Once you've successfully created your account and have received your log in details, you'll be able to start using the platform. Here's how to get started...
Table of contents
Welcome to The Data City
Once logged in, the first thing you will see is your dashboard.
This is where you can quickly access saved searches, jump into the latest Real-Time Industrial Classifications (RTICs) and even see what's new in the platform.
 Any Machine Learning (ML) or EXPLORE Lists you've saved or shared will be accessible from your Dashboard.
RTICs
Real-Time Industrial Classifications, or RTICs, are our proprietary industry classifications.
In the platform, we have over 400 emerging economy sector classifications from AgriTech and Net Zero to AI and FinTech.
These are easily accessible via our RTICs tab and provide a great way to start your journey.
 In RTICs, you'll be able to see our full list of RTICs and RTIC Verticals, the amount of companies classified and links to ANALYSE each RTIC.
By clicking the arrows, you can see key details about each RTIC. This includes:
- RTIC code
- Creation date
- Revised date
- Companies
- Description
- Verticals
To understand more about each RTIC and their ranking within our platform, click the Summary tab.
This allows you to quickly filter and order sectors based on a number of key metrics, including turnover, employees, investment and growth.
.gif?width=688&height=387&name=Untitled%20design%20(1).gif) This is a great way to find growing sectors or RTICs with the largest amount of companies or funding.
This is a great way to find growing sectors or RTICs with the largest amount of companies or funding.
You can also filter these by Region, allowing you to see breakout sectors in your local area.
From the Summary tab you can further your research and see a host of sector trends and insights on the ANALYSE page. Simply click the ANALYSE icon on the left hand side.

Tip: To see a full list of companies for each sector you can also access RTICs via the Filters in Explore.
Explore
EXPLORE allows you to do just that. Explore. This is where you can see our company database, RTICs and lists you've built in full.
This section showcases a list of companies across a range of pages, with key data and information highlighted for each.

At a glance, you'll be able to see company information, RTICs and financial estimates. Perfect for when you're training an ML list or vetting prospects.
Looking for more detail on a specific company? From here you can dig into our in-depth company-level data.
By clicking 'Full Info', you can view a wide range of data points and information about a specific company.
.gif?width=688&height=387&name=Untitled%20design%20(2).gif)
This includes key contact information, financial and funding data, growth measures and estimates, employee stats, sector classifications, locations and much more.
Our data: You can find out more about our proprietary and 3rd party data, and how to best use it on our Data page.
In EXPLORE you can also tailor your search based on a wide range of filters.
You can filter an existing ML list or start from scratch, filtering by RTIC, SIC code, location, keywords, financials, company and growth measures.
![]()
Additionally, take your analysis to the next level and uncover key trends and insights in ANALYSE.
You can also easily download, save or make other key edits to your list directly from EXPLORE.
Using EXPLORE: Find out more about our EXPLORE tool and how it works in our Using Explore guide.
Analyse
In ANALYSE you can take your analysis to the next level with our suite of dashboards and statistics.
This is ideal for getting a macro view of a sector or list, allowing you to easily spot trends and identify opportunities in larger datasets.
-2.gif?width=688&height=387&name=Untitled%20design%20(3)-2.gif) There are seven key sections in ANALYSE. This includes analysis summary, location data, website keywords, company details, jobs and skills, RTICs and sectors, and financials.
There are seven key sections in ANALYSE. This includes analysis summary, location data, website keywords, company details, jobs and skills, RTICs and sectors, and financials.
Graphs and tables in ANALYSE can be filtered or edited to suit your analysis. You can easily update the field, data format or chart type.
Example: In the Locations dashboard, you can customise tables and graphs based on your preferred location type, such as local authority, OECD functional urban area, constituencies, ITL1 region, and more.
You can load ML lists directly into ANALYSE, jump into RTICs or build your own analysis using our filters. These match the filtering system seen in EXPLORE.
From here you can always download your ANALYSE data for offline usage or view the full list of companies in EXPLORE.

Create an ML list
As well as the ability to build EXPLORE lists using our filters, you can also build ML lists within the platform.
The Data City's AI allows users to effortlessly build bespoke company lists in minutes. This utilises the same tech used to build our expert-backed RTICs.
You can use the ML (machine learning) list builder to find companies in a niche sector or upload a list of prospects to find lookalikes.
To build a new list, simply head to MY LISTS, and hit 'Create a New List'.
In this section you'll train our AI with some example data.
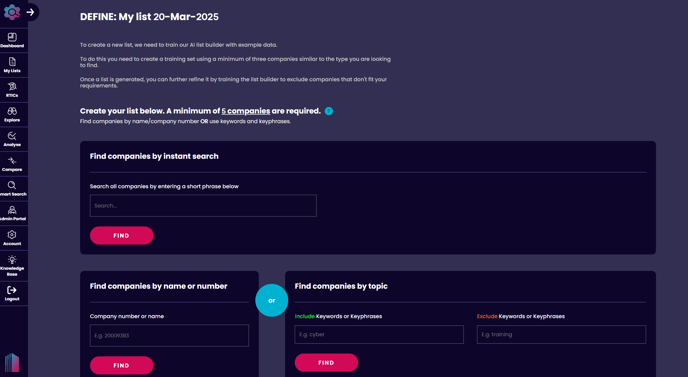
All you need to get going is a minimum of five companies. These should be companies similar to the list your trying to build.
Example: If you were interested in finding FinTech companies, you might add five FinTech companies you're already aware of such as Revolut, Monzo, Starling Bank, Klarna and Experian.
You can add companies directly via the search functionality or you can find companies based on a keyword or topic.

In the topic section, you can include or exclude companies in your search by keyword. These could be sector trends, industries, products, services, innovation terms or other niche topics.
Example: If you were interested in digital marketing agencies that offered PPC services, you could include the keywords 'ppc', 'pay per click', 'Google AdWords', 'paid media', 'digital marketing' and 'agency'.
Once you've added a minimum of five companies, you're ready to build your list.
When you've finished, the platform will start populating your initial list of companies.
.gif?width=688&height=387&name=Untitled%20design%20(5).gif) From here you'll need to further train your dataset and exclude some companies that don't match your results. This allows the AI to better understand your search.
From here you'll need to further train your dataset and exclude some companies that don't match your results. This allows the AI to better understand your search.
The more inclusions and exclusions you make to your list from here, the better your results will be.
From here you can start using your company list in EXPLORE. You can view individual company details, refine further with filters, download data or view insights in ANALYSE.
Building an ML list: Want to find out more? View our full in-depth, step-by-step ML List guide today.
MY LISTS
To get a comprehensive view of your lists and searches, simply head to MY LISTS.

From here you can create new lists and access all your most recent searches, with the option to Explore companies, see list information and make key edits.

You can also create folders and assign lists directly from the MY LISTS section. This is helpful for managing bigger projects and multiple company lists.
What's next?
Now you understand the basics of the platform you're free to explore the platform.
Interested in learning more about The Data City, our data and how to make the most of the platform? You're in the right place.
Our Knowledge Base is the best place to find step-by-step guides, use cases and FAQs.
Quick links
- Glossary / Data Dictionary - a one stop shop for finding info on all of our data points.
- Using our data safely - a few things that you should bear in mind when using our data, including some limitations.
Need some support? Please don't hesitate to get in touch with your account manager or a member of The Data City team.