Table of contents
Introducing COMPARE
Our COMPARE page tool allows you to quickly compare and contrast two datasets through visualisations of overview statistics.
It is based around our separate ANALYSE tool. Essentially, it allows you to combine two separate ANALYSE page views side-by-side.
Getting started
The COMPARE tool is a core feature of our platform and can be accessed from the link in the header bar.
When you first navigate to the page you will be presented with a blank view and two sets of controls, one for each dataset.

The control bars allow you to define your comparison and can be configured in two ways:
- Using filters to define a sector from scratch.
- Loading a pre-existing EXPLORE list.
Filters
The COMPARE page uses the same set of filters as other Data City tools. Company searches can be refined based on properties such as RTICs (Real-Time Industry Classifications), location and financials.
Using filters: for more information about our filters and how to use them please visit our Using Filters page.
EXPLORE Lists
COMPARE allows you to quickly load in previously saved lists created on our EXPLORE tool.
To do this click the three dots in the top left of either of the two control bars and pick the "Load list" option.
Then pick the relevant list from the dropdown options. The control bar filters will automatically be updated.

Creating lists in EXPLORE: for more information about our EXPLORE tool please visit our Using EXPLORE page.
Naming your datasets
Each COMPARE dataset can be given a custom name.
To do this click on the textbox in either control bar and enter a new value. If you load in an EXPLORE list the dataset will automatically be renamed to match the list.

The two datasets are named "Group 1" and "Group 2" by default. Their names can be updated at any time without needing to recalculate the results.
Results
Once you are happy with your input hit the "Calculate" button at the top of the page to start processing the results.
The results for each dataset are displayed alongside each other. The COMPARE results contain all the same data fields available on our ANALYSE tool.
Total turnover, business counts and RTIC vertical membership are just some examples of the data available in COMPARE.
These are grouped into sections, and results are ordered by the combined count of both values for a datapoint.
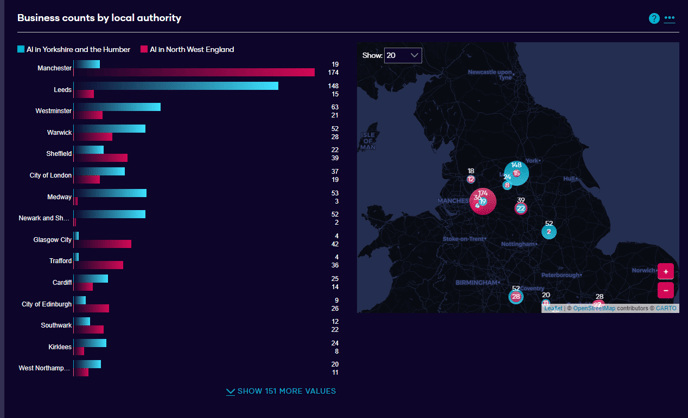
Pressing the three dots in the top-right corner of each data chart will allow you download the results for that particular field in CSV format.
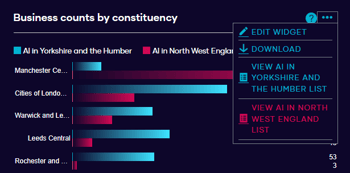
Through this menu you also have the option to see a company list view of either dataset in the EXPLORE page.
Overall the COMPARE page is a powerful tool for quickly visualising the differences between two lists. It offers a new way of easily seeing the strengths or weaknesses of industrial sectors.